

Analytics Dashboards
Bring data sources into KPI dashboards, scheduled reports and exception alerts.
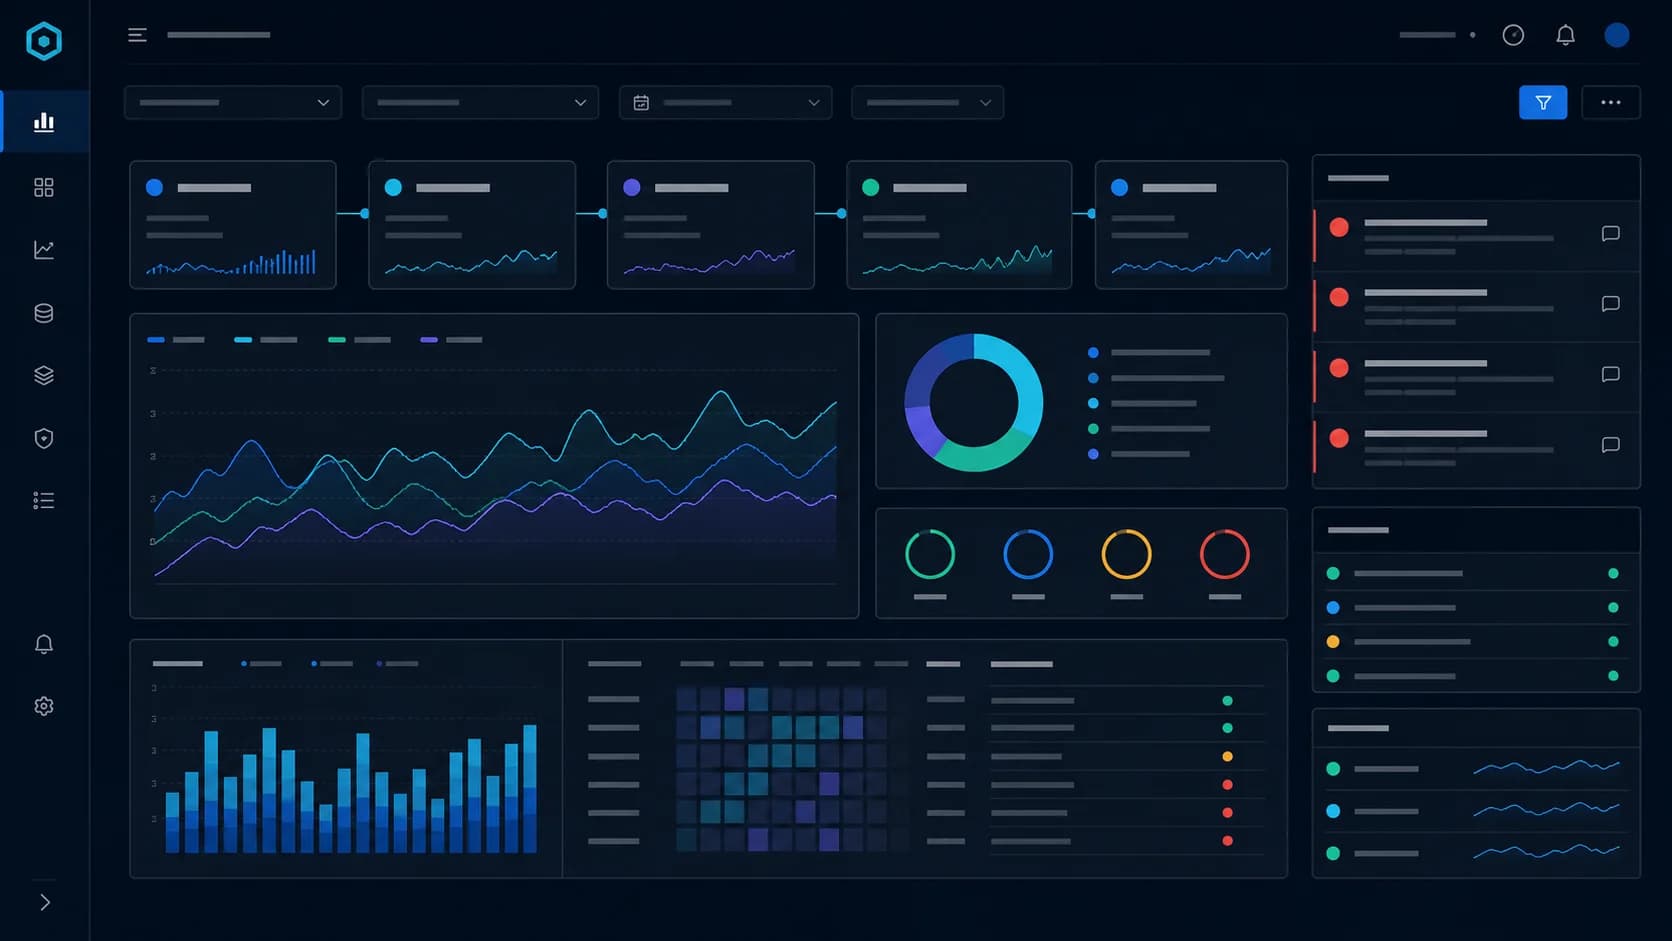
Meet Analytics Dashboards.
Analytics Dashboards organizes operational data into role-based indicators and recurring executive reports. Agree the data sources and metric definitions, then review performance and threshold exceptions without assembling every report by hand.
Who it is for
Leaders who need one version of performance
See how Analytics Dashboards could work.
What happens today
For Analytics Dashboards: How quickly can a leader move from signal to decision?
SAMPLE DATASample scenario: Unify operating data behind defined business measures.
Example result
Explore the example to inspect a prepared output using fictional data.
Example data. Available features and fields are confirmed for your project.How it fits your work
- 01
Unify operating data behind defined business measures.
- 02
Surface exceptions instead of another static report.
- 03
Move each signal toward a decision and named owner.
Capabilities to explore
- Connected data sources
- Role-based KPI dashboards
- Scheduled executive reporting
- Threshold alerts and exceptions
Questions about Analytics Dashboards
Who is Analytics Dashboards for?
Leaders who need one version of performance
How do I get access?
Ask our team about current access to Analytics Dashboards. Visiting the website does not create an account or activate a subscription.
What does it cost and include?
We prepare a quote around users, locations and scope. The proposal confirms currency, implementation, support, taxes and validity.
Can it be adapted or connected to my tools?
Tell us about your process and current tools. We confirm available features and integrations before agreeing the project; suite modules are not included or integrated by default.
Can I use my existing data, and when can we start?
We review your data format and permissions, users and required preparation. Import options, responsibilities and a schedule are agreed after that review.